Inspecting Prometheus metrics for e2e runs
Metrics gathering during e2e runs
kcp internally exposes the same metrics as kube api-server.
These are being gathered during e2e runs if the PROMETHEUS_URL variable is set.
Here, any e2e spawned kcp server will publish a scraping configuration to prometheus
for the given Prometheus URL environment variable.
For e2e tests, the above environment variable is respected by the following test servers:
- when a shared kcp server is spawned using
SharedKcpServerorPrivateKcpServerin thekcp.test.e2e.frameworkpackage. cmd/sharded-test-servercmd/test-server/kcp
Inspecting metrics of e2e runs
GitHub
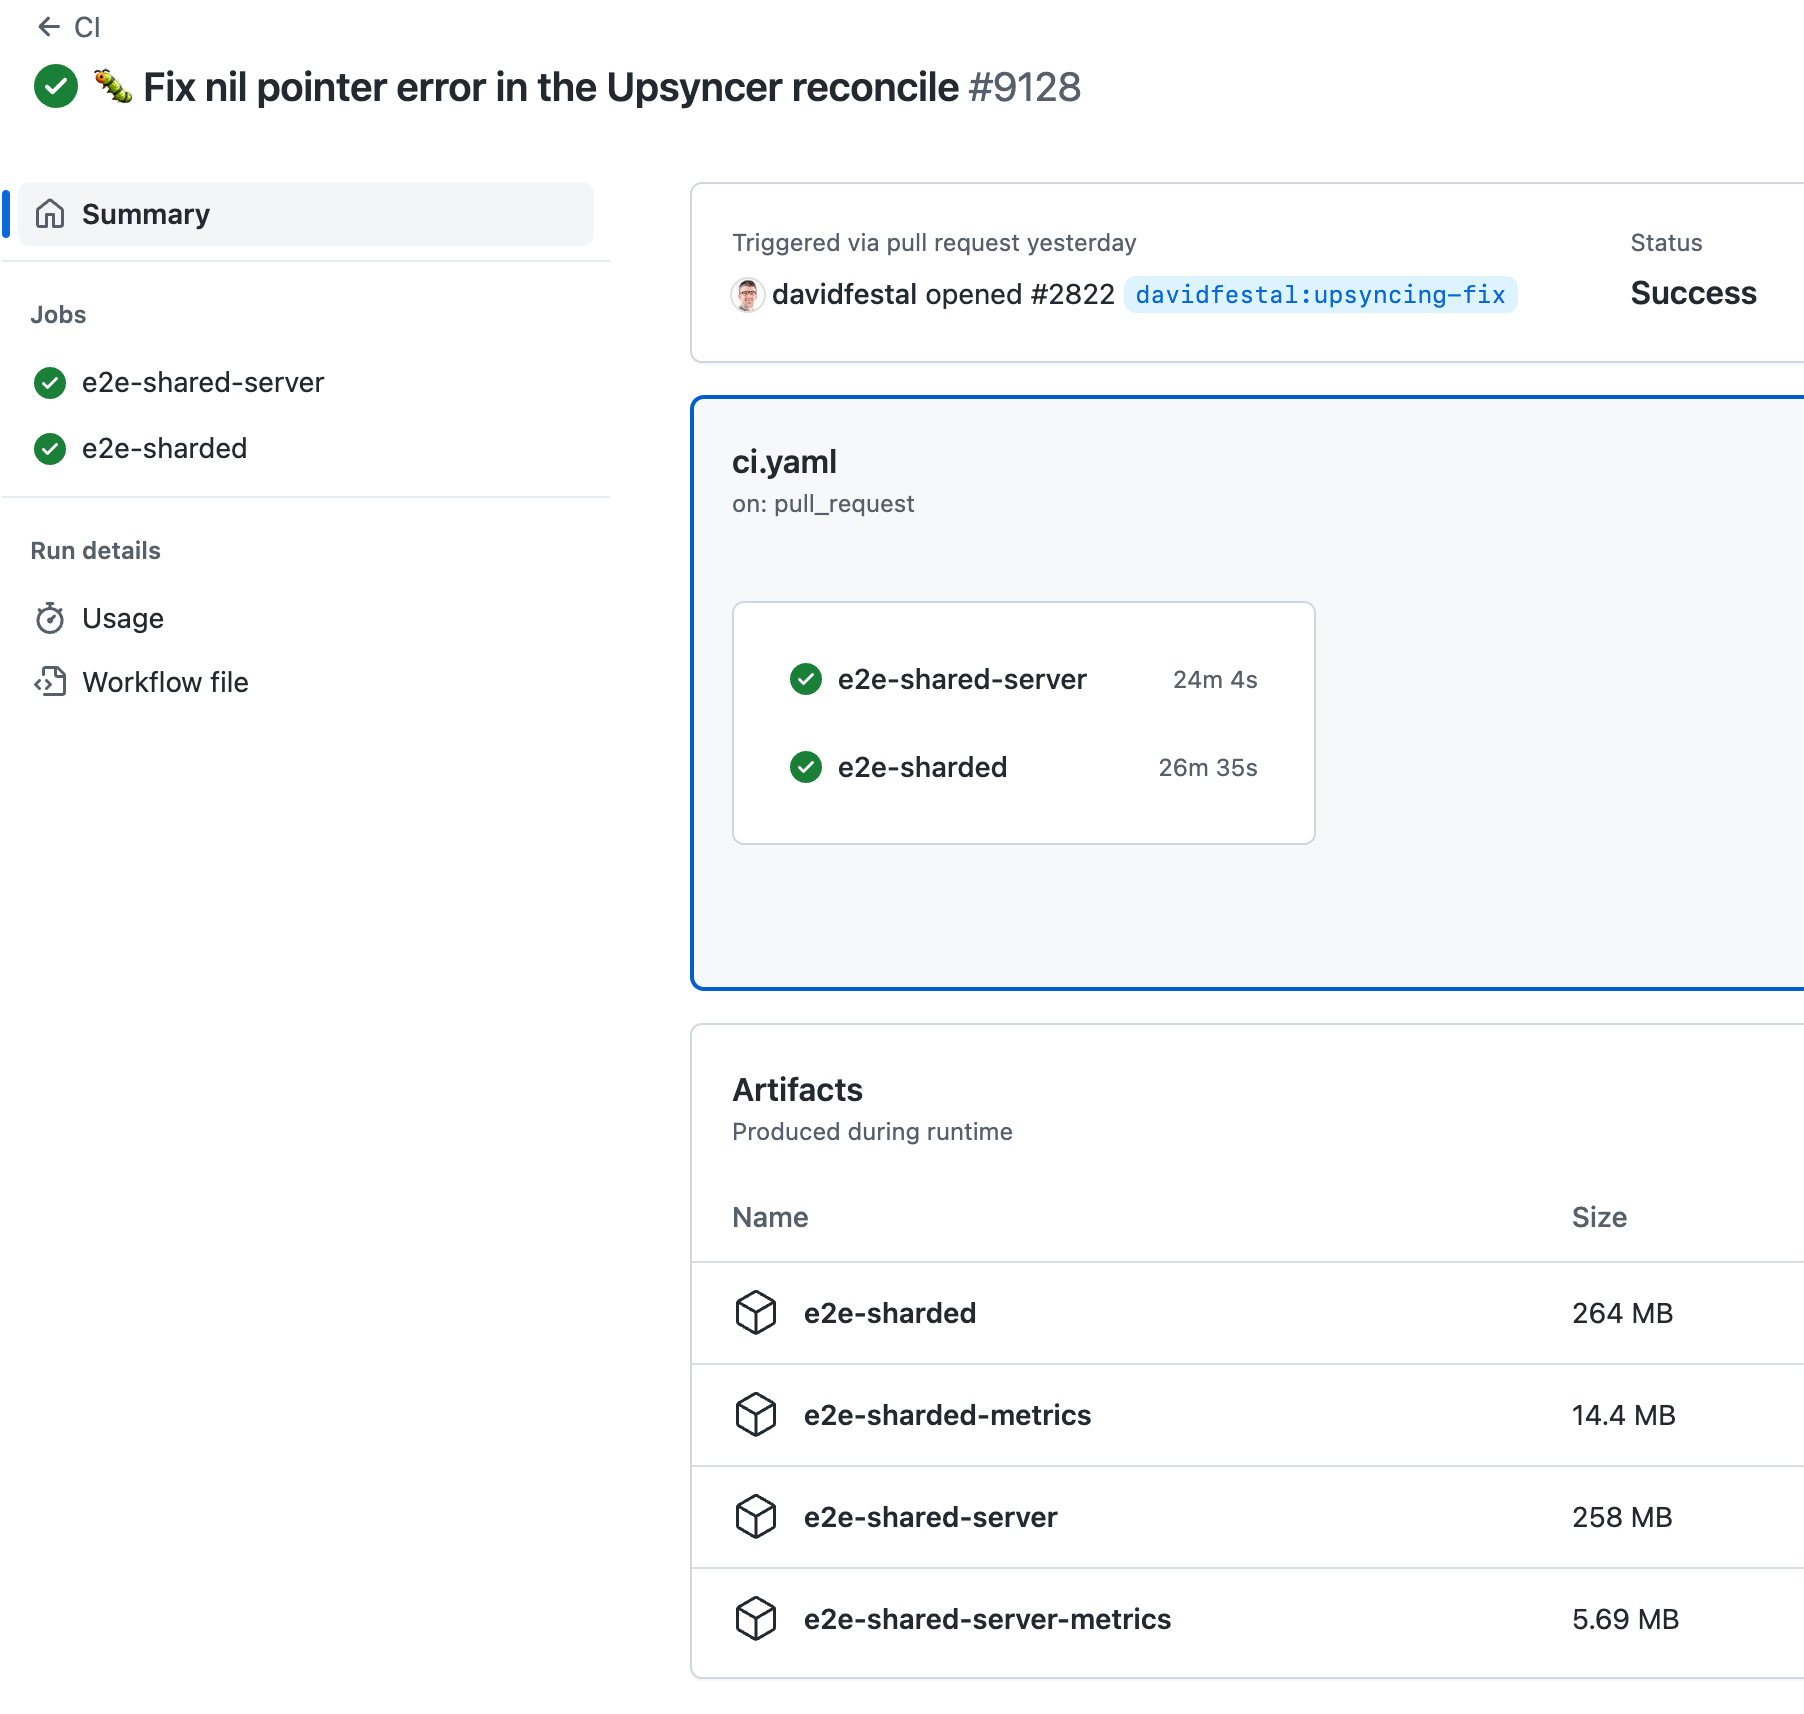
To inspect metrics from GitHub e2e test runs, download the metrics from the GitHub summary page:
And execute Prometheus locally to inspect metrics:
$ mkdir -p metrics && unzip -p e2e-sharded-metrics.zip | tar xvzf - -C metrics
$ prometheus --storage.tsdb.path=metrics --config.file /dev/null
Prow
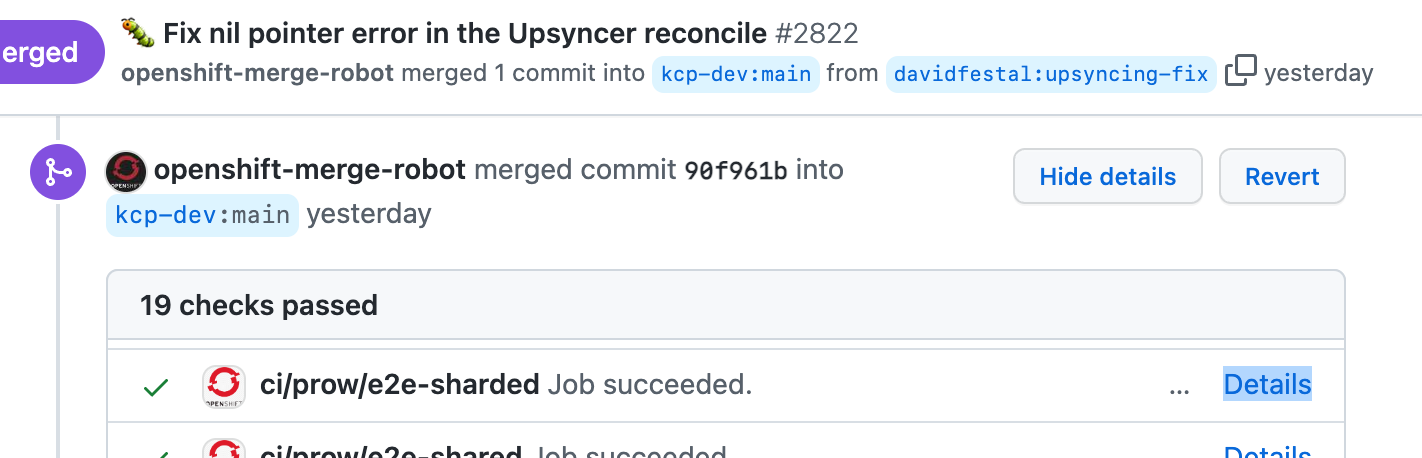
To inspect e2e metrics from prow runs, just copy-paste the prow link from the pull request:
And paste it into PromeCIeus:
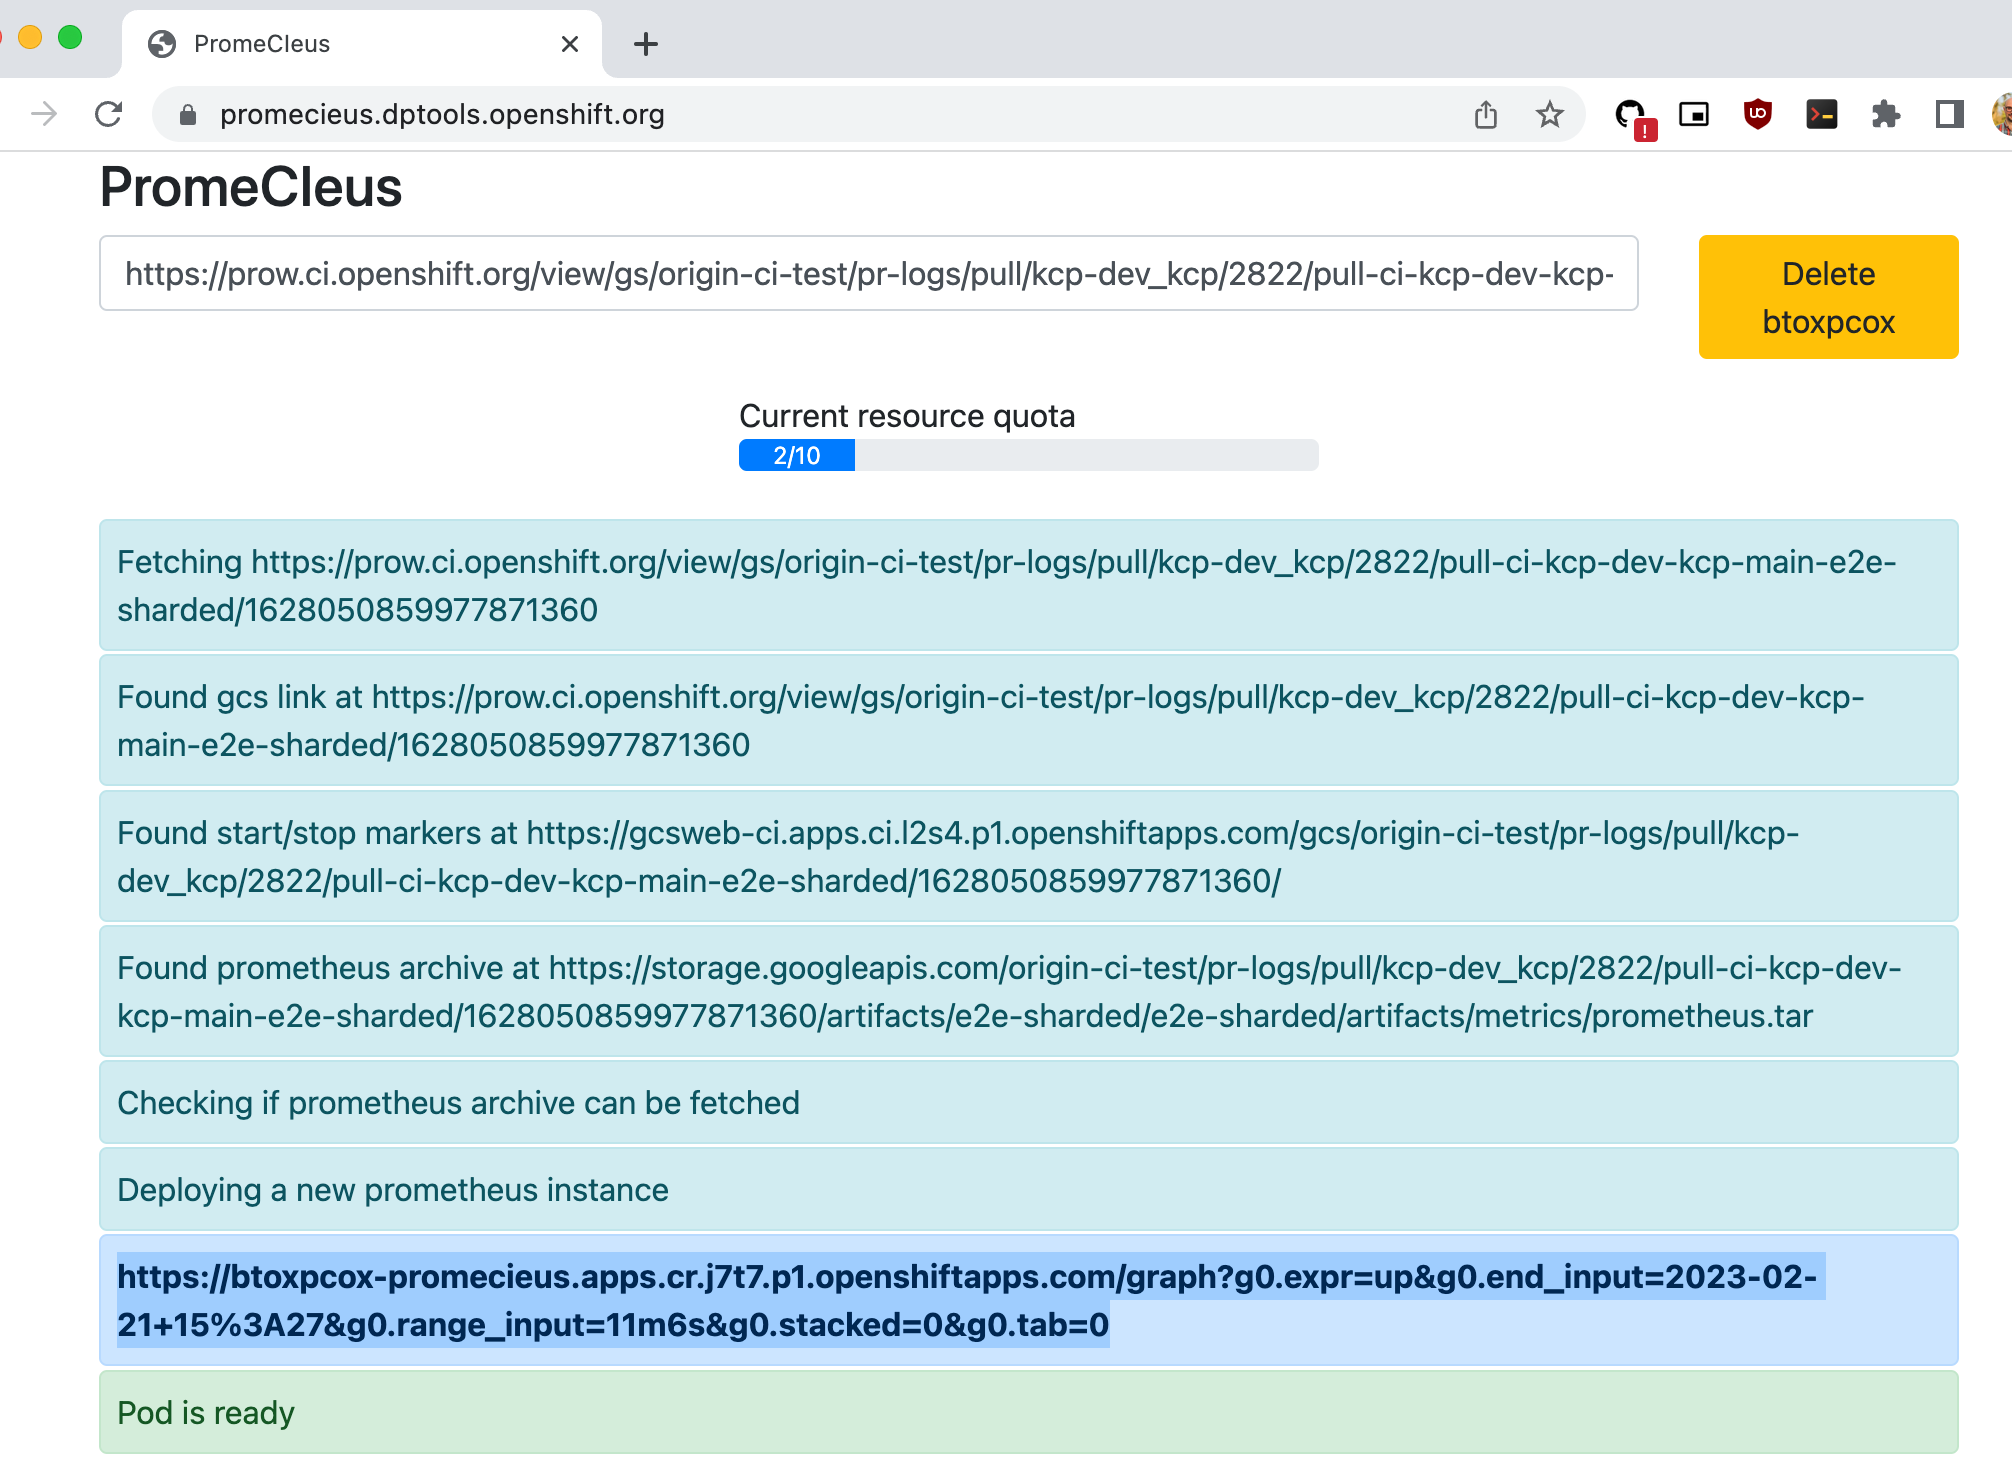
Once the Prometheus pod is ready, the provisioned link can be called to inspect gathered metrics. Alternatively, download the prometheus tarball from the gcsweb frontend locally and start a Prometheus instance as described above.
Collecting metrics locally
To collect metrics locally, a convenience script is available to download and execute a Prometheus instance.
Calling ... ./hack/run-in-prometheus make ... will download, start, collect metrics, and stop Prometheus during the test run.
Example:
A local Prometheus can then be started to inspect gathered metrics: